Waka Kotahi
How to use data visualisation to motivate action.
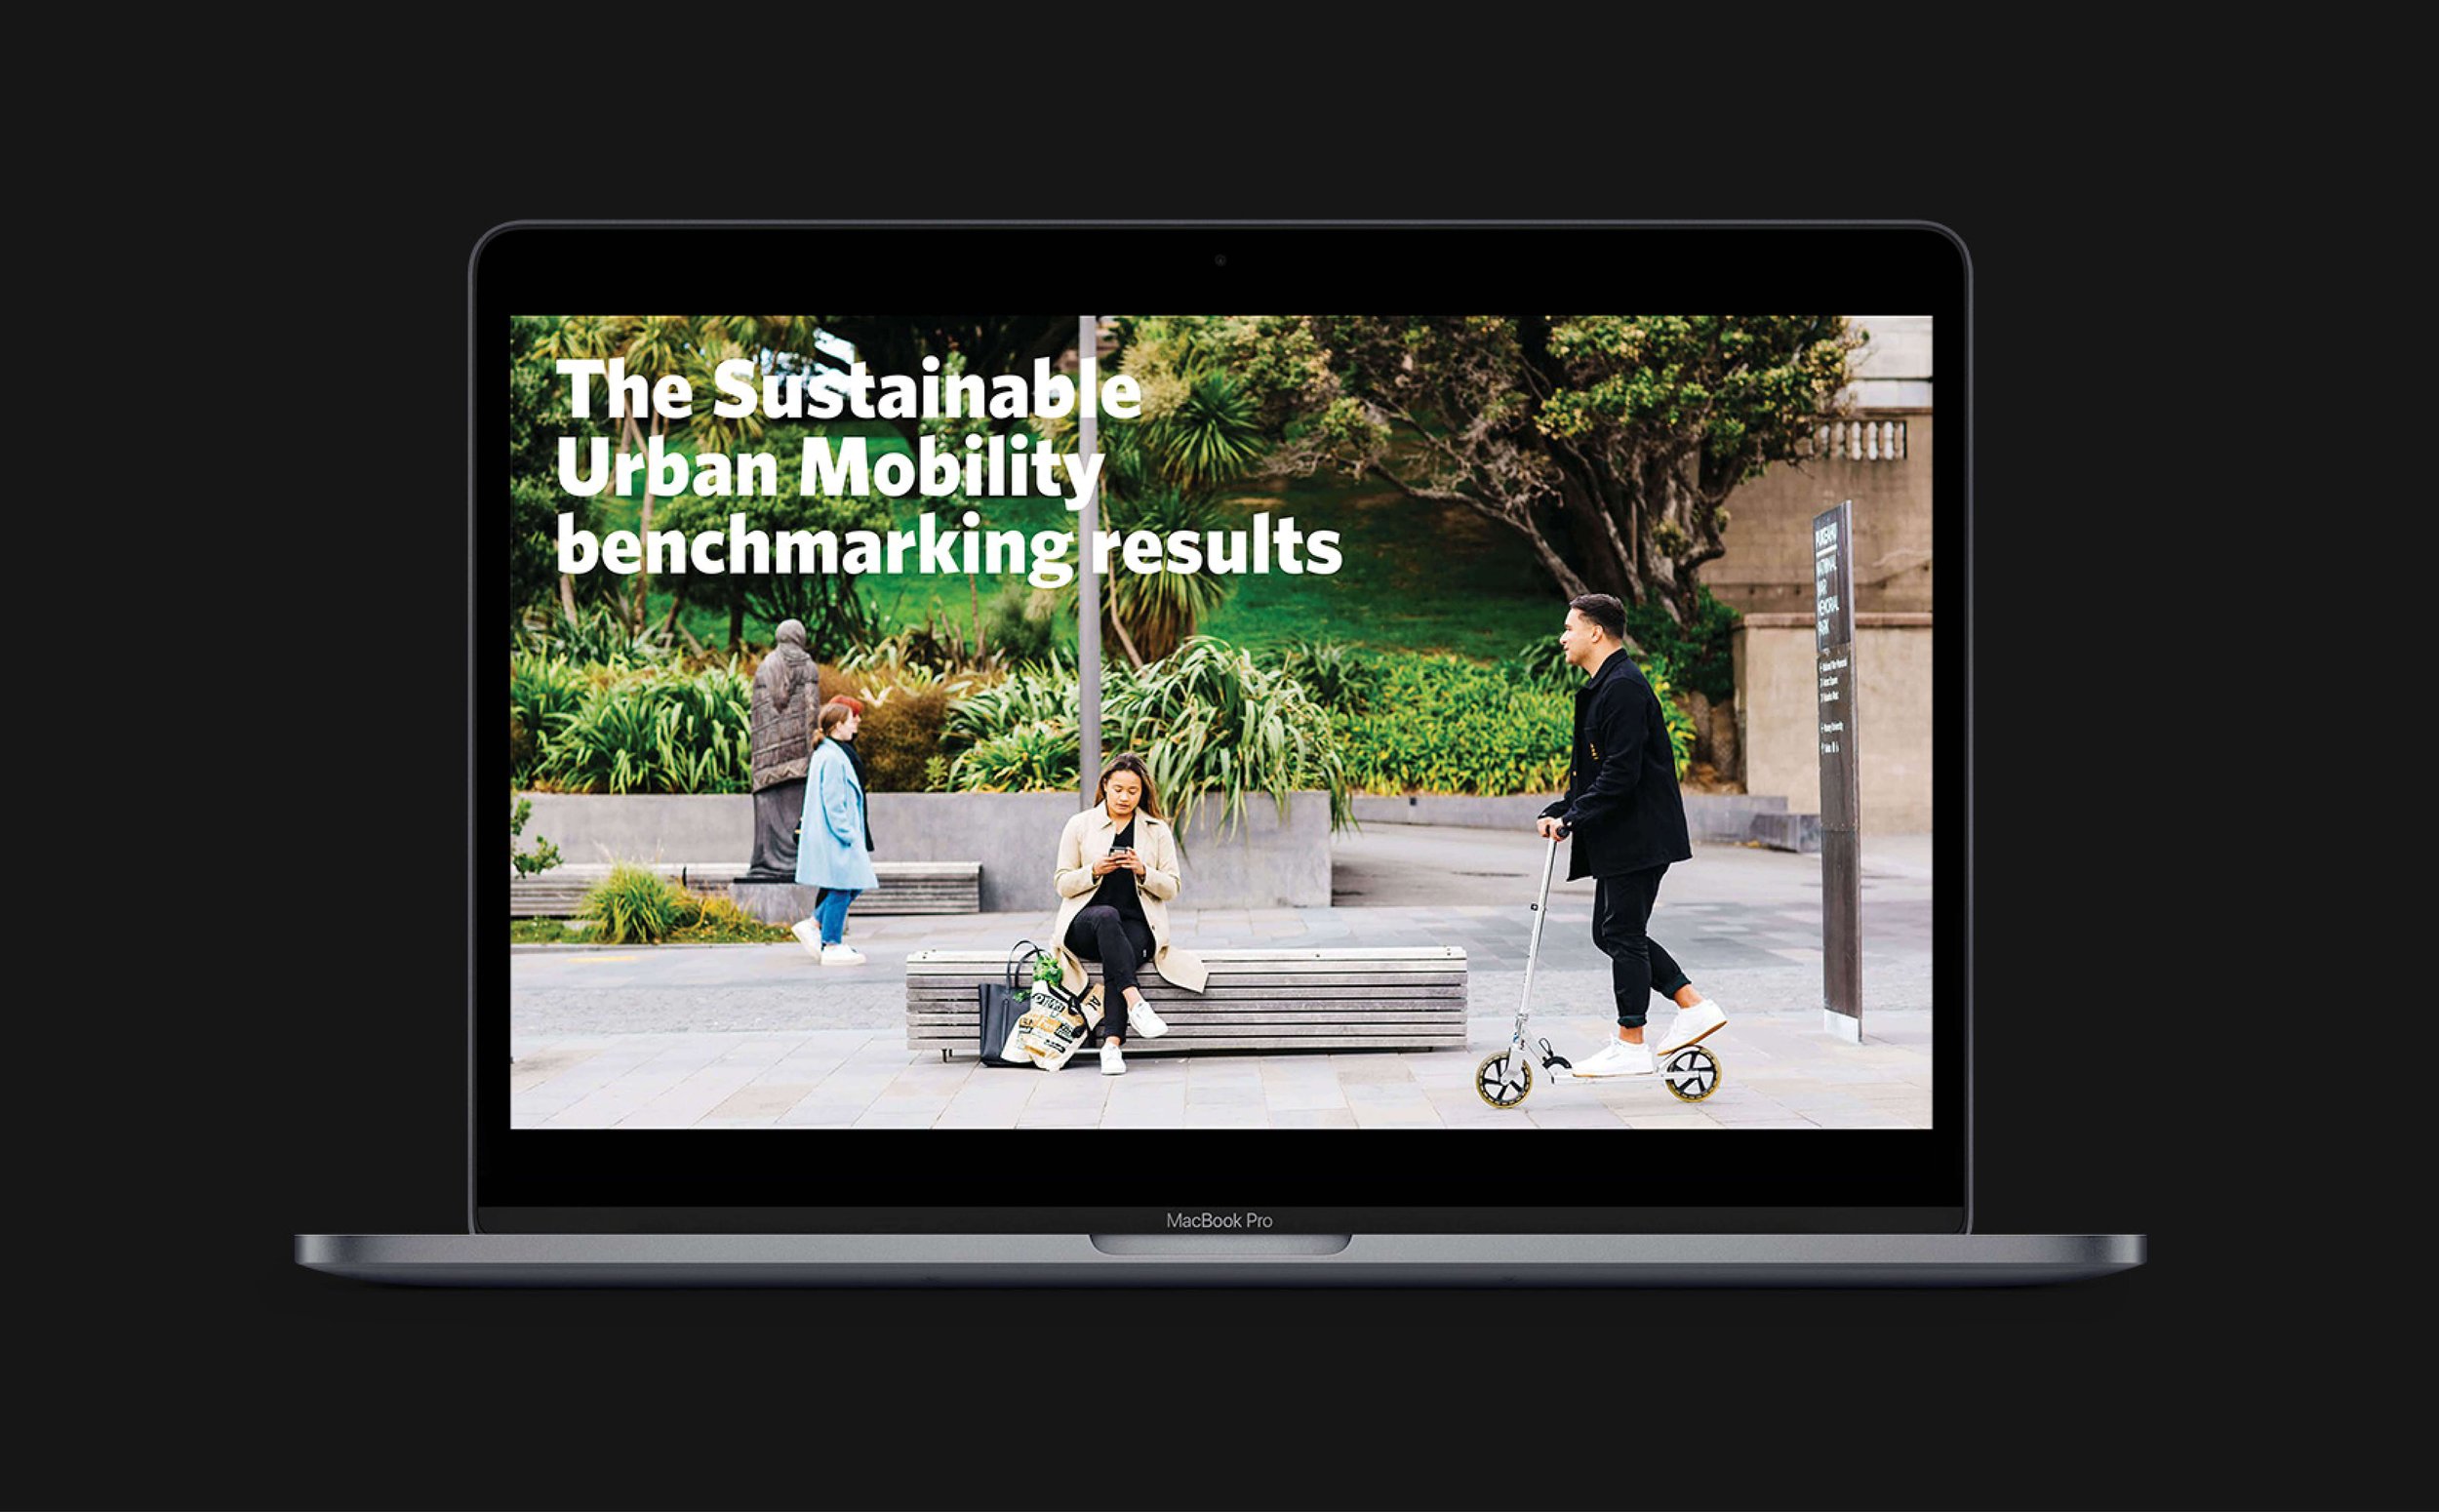
This was the first benchmarking report from Waka Kotahi comparing New Zealand’s five urban centres on their journey towards delivering a low carbon, safe, and healthy urban mobility environment.
The ask was to create an engaging report using data visualisation to motivate action. The approach was to create a sense of connectedness through colour and clear communication.
Designed working at TRA